At Symbl.ai, we are constantly looking for ways to improve your developer experience. We are quite excited to announce the all new “API Usage” feature. Using this feature, you can dive deep into the world of Symbl.ai’s API analytics and usage! 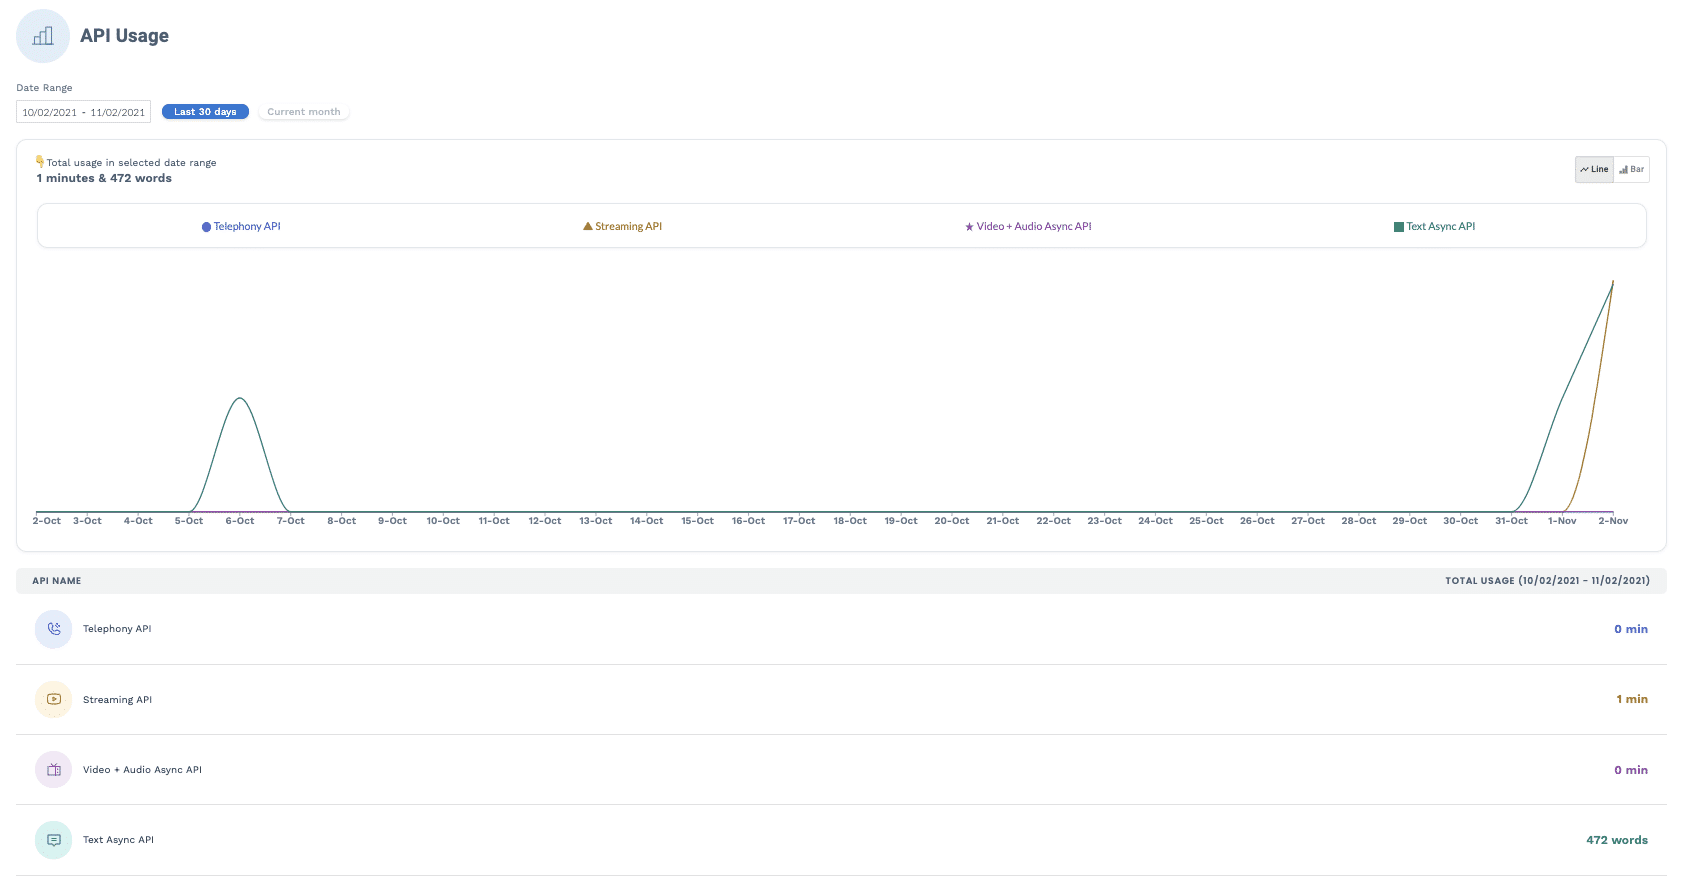
- Streaming API
- Telephony API
- Async Video & Audio API
- Async Text API.
- Usage for Streaming API vs Telephony API for the last 6 months and understand which is used the most
- How many minutes per call have you done with an API?
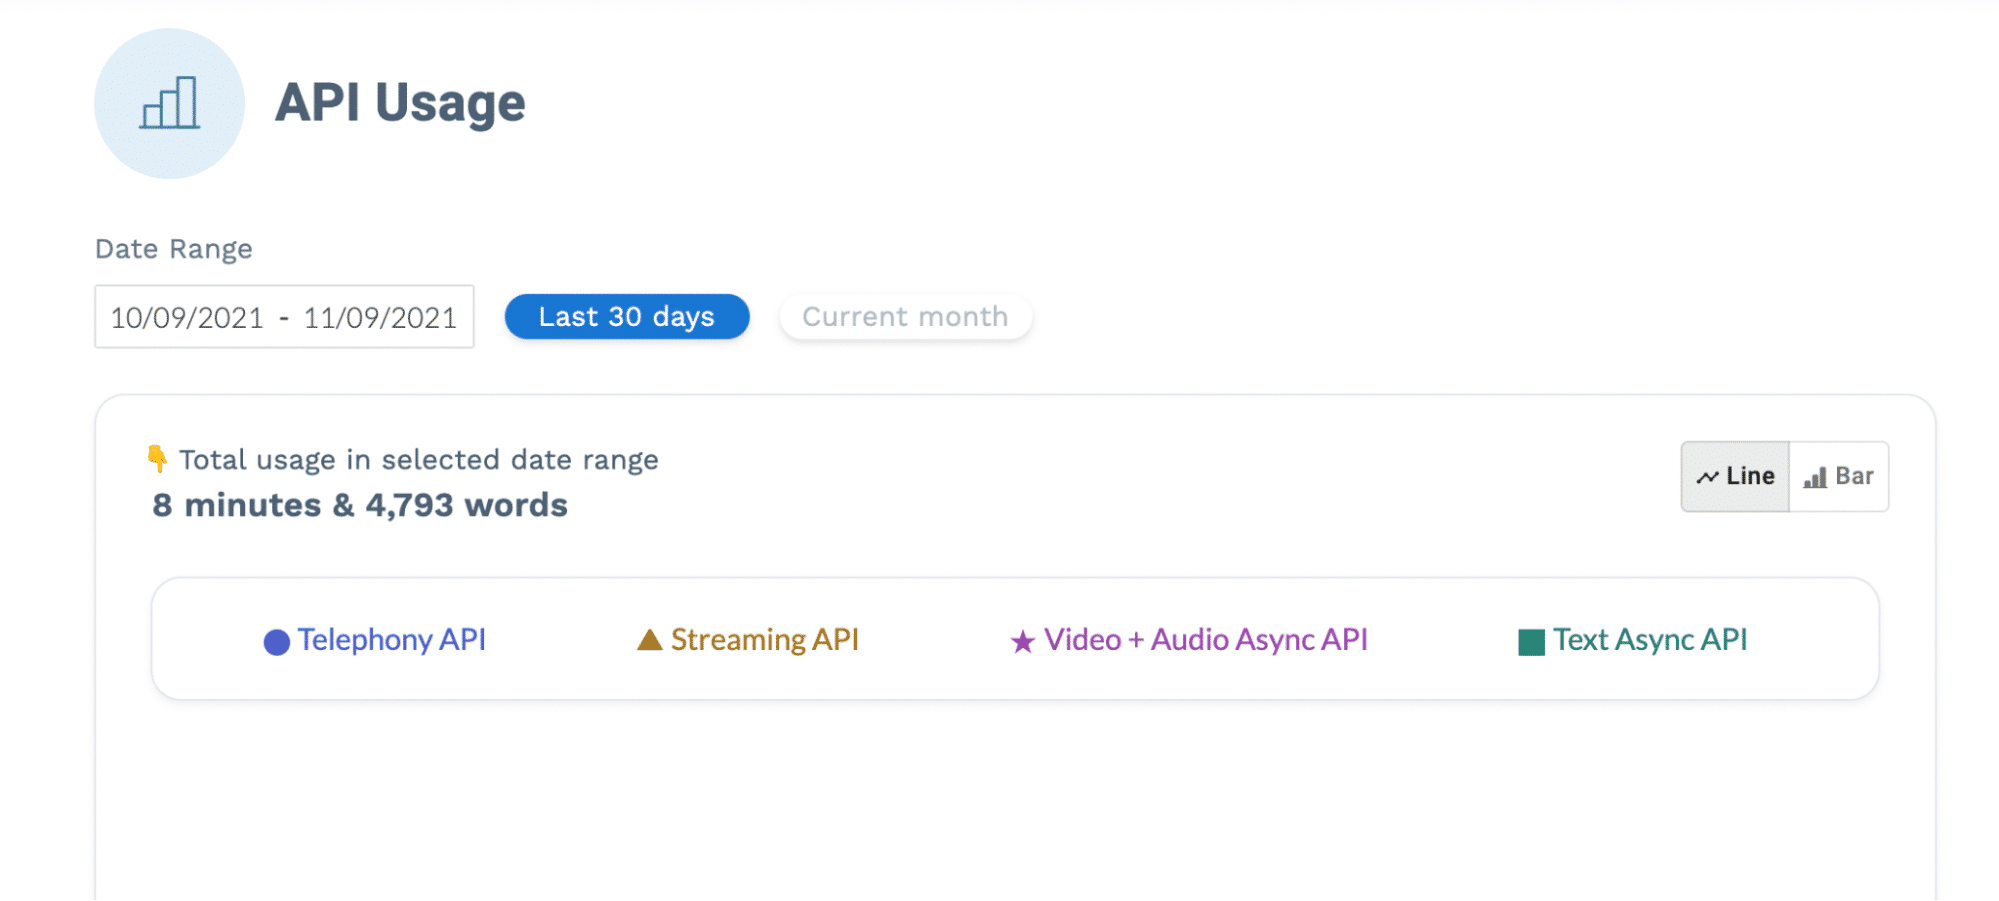
- You can select the last date range over last month and see overall API usage.
Symbl.ai’s visualizations for API usage are in keeping with Symbl.ai’s own mission to enable developers to connect, transform or visualize. With easy to read graphs of API usage, you are able to readily understand which APIs are used the most, which APIs are used the least. It provides you with deeper analytics of your API’s Usage over time for your product integration growth. Overall, your ability to see API usage puts you in a better position to make strategic decisions. 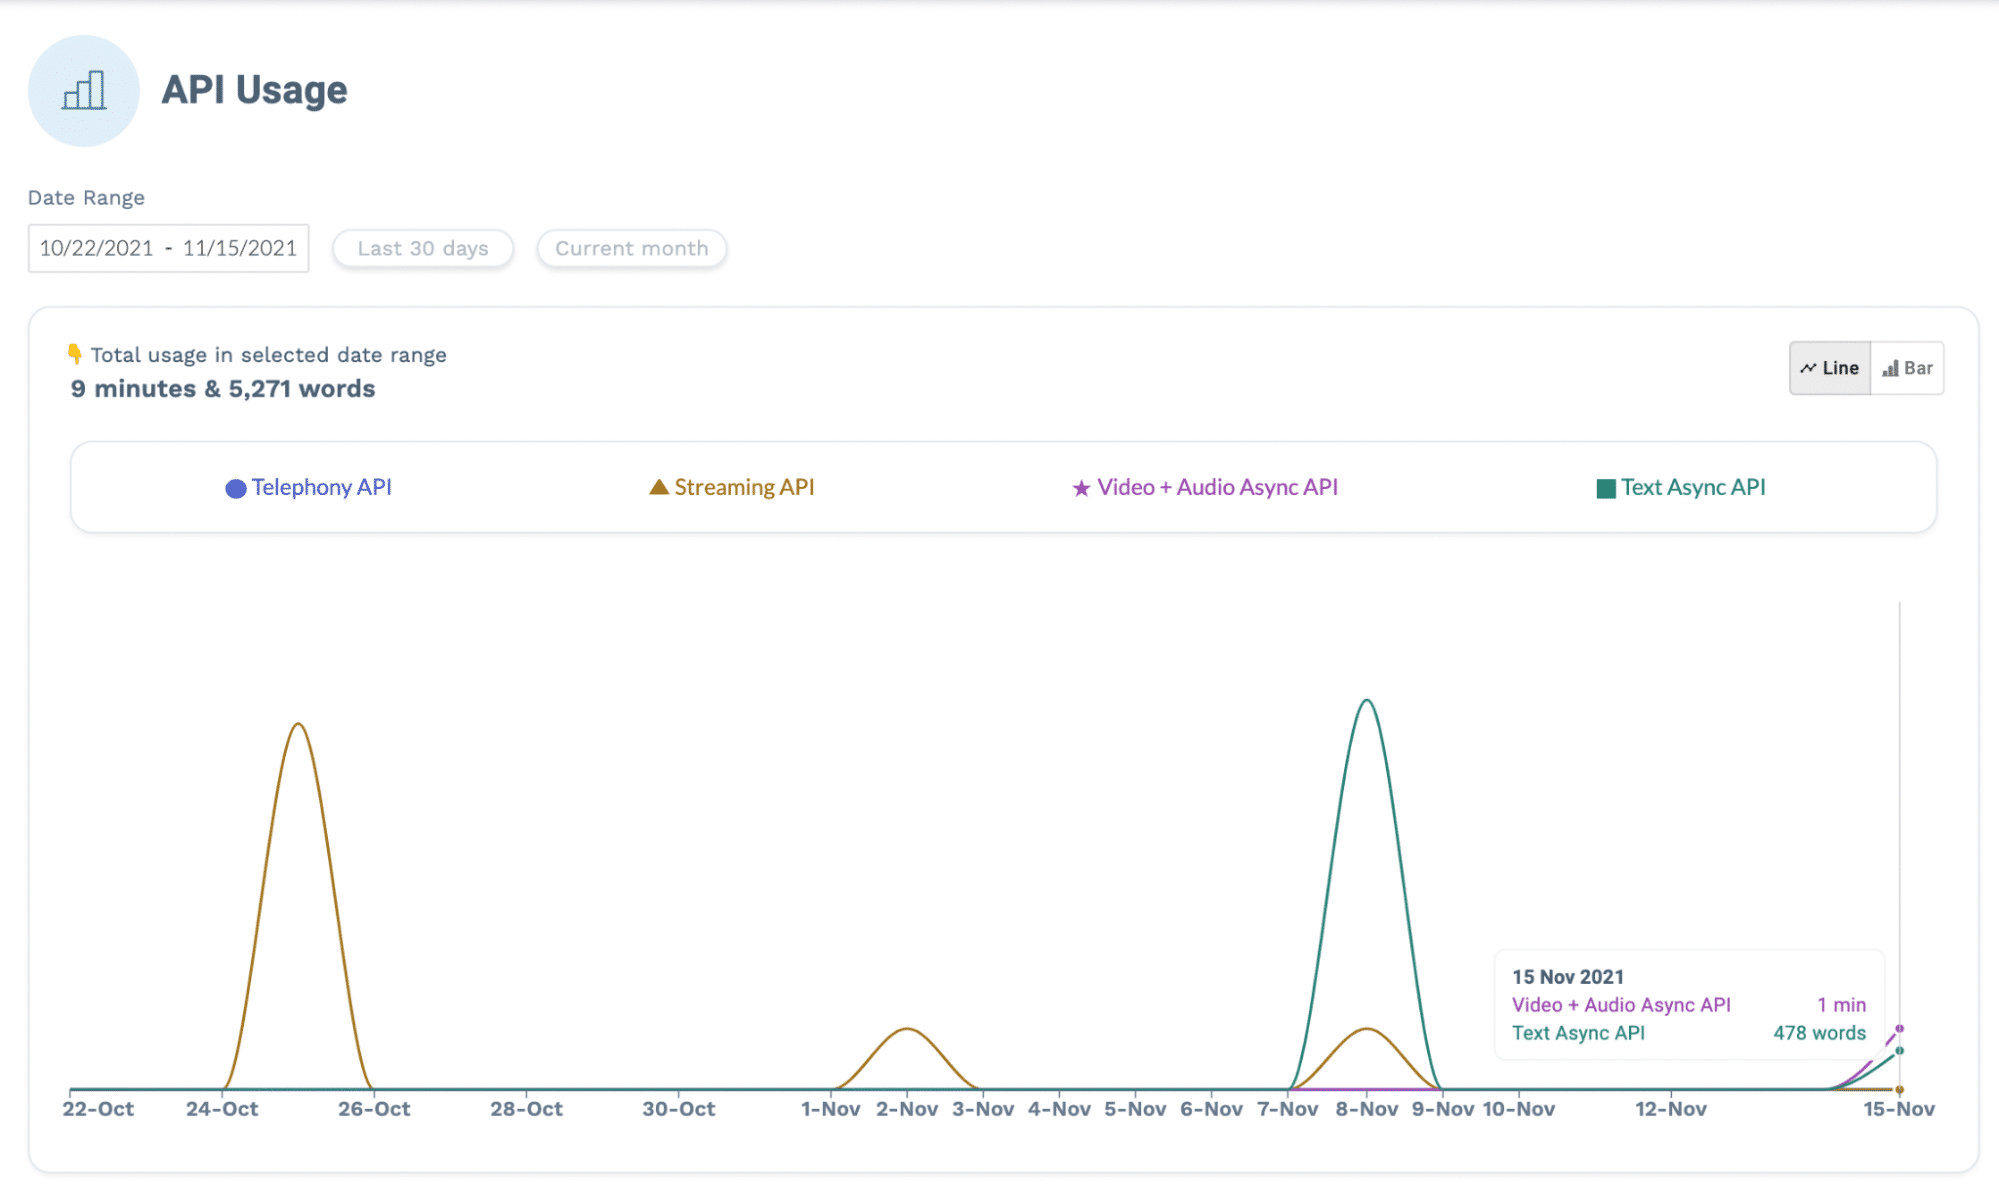
How to use this feature?
After signing up for a free developer account, you access this feature here: https://platform.symbl.ai/#/usage. If you don’t have an account, sign up for a free developer account here. It will only take 2 minutes, no credit card is required, and you will get free monthly credits to use.
What is next?
If you have not already used our API Playground and explored our powerful conversational intelligence you should give it a try. Online Speech to Text and Insights Playground Textual data processing and Insights Playground