
The analysis of conversation data is one of the many ways that companies who have been impacted by the massive shift from office to remote work is digitally transforming their real-time communications stacks. Symbl.ai is a Conversation Intelligence API platform designed to enable developers to accelerate their ability to extract insights from multiple conversations occurring in real-time throughout an organization or from one business to another. One of the ways that Symbl.ai extracts insights extends beyond mere transcription of live speech to analyzing the key features of a speaker during a conversations. Symbl.ai’s Conversation API for Speaker Analytics analyzes the following speaker’s key features: overlap (i.e., interruptions), silence, pace, speaker ratios (i.e., speaker’s talk and listen ratio and time), or talk time. In the following blog you explore Symbl.ai’s Speaker Analytics API by measuring the talk time of a speaker with a bar graph. You use PHP and Graph.js to create the metrics and dimensions of these bar graphs.
Prerequisites
- Basic knowledge of PHP
- Symbl.ai API Keys
- JavaScript
- Bootstrap 4
- Graph.js
- MAMP/LAMP/WAMP
Step 1: Getting the API Keys
Getting the API keys is simple. Just create a new account on Symbl.ai website, verify your email, and login to the website. On the main page, you’ll see a small box with the heading “API Credentials”. Well, yeah! That’s your API credentials. Once you found your API Keys, it’s time to move to the second step.
Step 2: Setting up the project and creating the index page.
Now create a folder, and then create an index.php file. This will be our home page we are going to pass the API credentials and the conversation id. In index.php paste the below code:
<!doctype html> <html lang="en"> <head> <meta charset="utf-8"> <meta name="viewport" content="width=device-width, initial-scale=1, shrink-to-fit=no"> <meta name="description" content=""> <meta name="author" content=""> <link rel="icon" href="/docs/4.0/assets/img/favicons/favicon.ico"> <title>Symbl.ai</title> <link rel="canonical" href="https://getbootstrap.com/docs/4.0/examples/floating-labels/"> <!-- Bootstrap core CSS --> <link href="bootstrap.css" rel="stylesheet"> <!-- Custom styles for this template --> <link href="floating-labels.css" rel="stylesheet"> </head> <body> <form class="form-signin" action="submit.php" method="POST"> <div class="text-center mb-4"> <img class="mb-4" src="https://symbl.ai/wp-content/uploads/2020/07/Symbl-Logo-1.svg" alt="" > <h1 class="h3 mb-3 font-weight-normal">Symbl.ai Conversations API</h1> <p>Please enter your <code>APP ID, App Secret</code> and <code>Conversation ID</code></p> </div> <div class="form-label-group"> <input type="text" id="inputEmail" name="app_id" class="form-control" placeholder="APP ID" required autofocus> <label for="inputEmail">APP ID</label> </div> <div class="form-label-group"> <input type="text" id="inputPassword" name="app_secret" class="form-control" placeholder="APP SECRET" required> <label for="inputPassword">App Secret</label> </div> <div class="form-label-group"> <input type="text" id="inputCon" name="conversation_id" class="form-control" placeholder="Conversation ID" required> <label for="inputCon">Conversation ID</label> </div> <button class="btn btn-lg btn-primary btn-block" type="submit">Generate Graph</button> </form> </body> </html>Code Explanation:
In the following HTML code snippet you create a simplified form that takes through its three text fields, three inputs. These are APP ID (i.e., for the appId), API Secret (i.e., for the appSecret), and Conversation ID (i.e., conversationId). It looks something like the following: 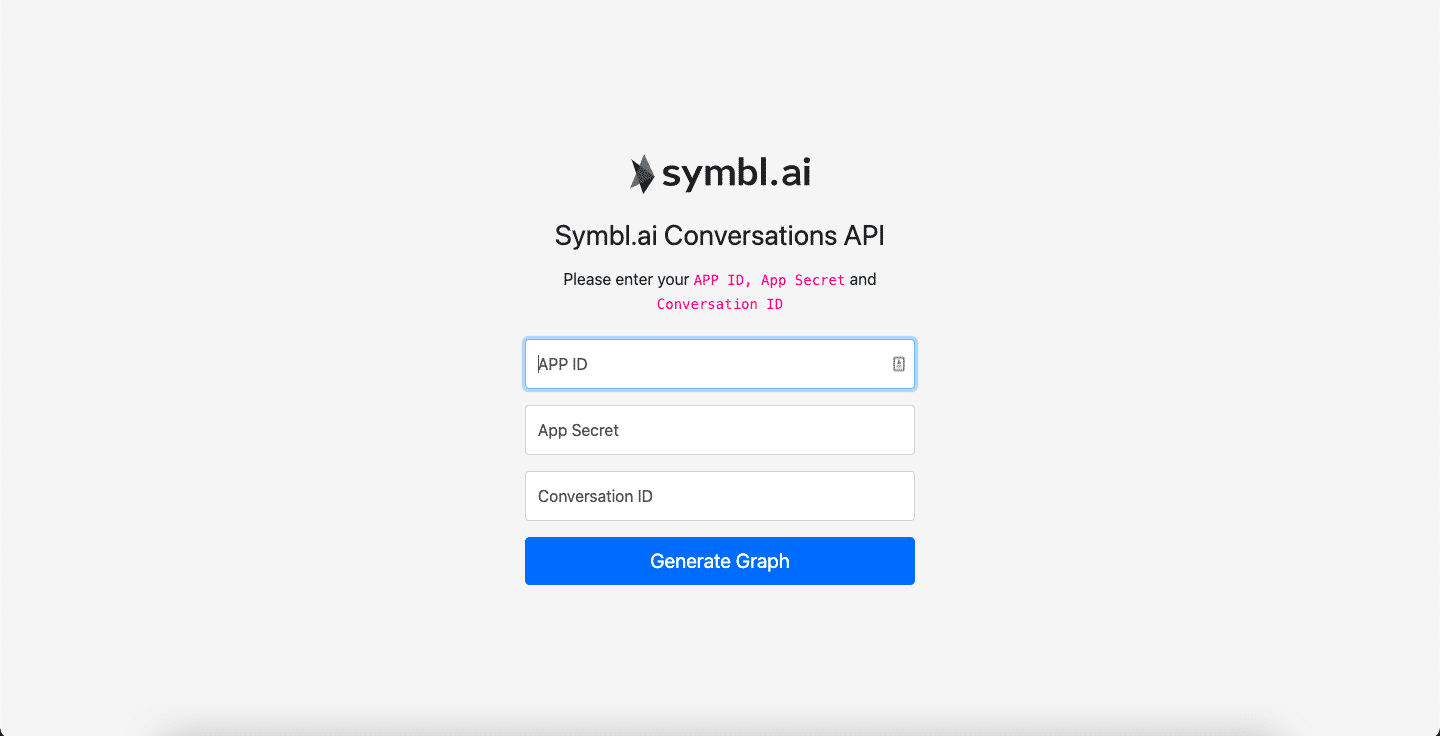
Step 3: Creating the submit page
Now create another PHP file, name it as submit.php and paste the below code:
<?php function generateToken($app_id, $app_secret){ $curl = curl_init(); curl_setopt_array($curl, array( CURLOPT_URL => 'https://api.symbl.ai/oauth2/token:generate', CURLOPT_RETURNTRANSFER => true, CURLOPT_ENCODING => '', CURLOPT_MAXREDIRS => 10, CURLOPT_TIMEOUT => 0, CURLOPT_FOLLOWLOCATION => true, CURLOPT_HTTP_VERSION => CURL_HTTP_VERSION_1_1, CURLOPT_CUSTOMREQUEST => 'POST', CURLOPT_POSTFIELDS =>'{ "type": "application", "appId": "'.$app_id.'", "appSecret": "'.$app_secret.'" }', CURLOPT_HTTPHEADER => array( 'Content-Type: application/json', ), )); $response = curl_exec($curl); return json_decode($response, true); } function getConversationAnalytics($token, $conversation_id){ $curl = curl_init(); curl_setopt_array($curl, array( CURLOPT_URL => 'https://api.symbl.ai/v1/conversations/'.$conversation_id.'/analytics', CURLOPT_RETURNTRANSFER => true, CURLOPT_ENCODING => '', CURLOPT_MAXREDIRS => 10, CURLOPT_TIMEOUT => 0, CURLOPT_FOLLOWLOCATION => true, CURLOPT_HTTP_VERSION => CURL_HTTP_VERSION_1_1, CURLOPT_CUSTOMREQUEST => 'GET', CURLOPT_HTTPHEADER => array( 'x-api-key: '.$token, 'Authorization: Bearer '.$token ), )); $response = curl_exec($curl); curl_close($curl); return json_decode($response, true); } if($_POST['app_id'] <> "" AND $_POST['app_secret']<> "" AND $_POST['conversation_id']<> ""){ $token = generateToken($_POST['app_id'], $_POST['app_secret']); if(isset($token['accessToken'])){ $token = $token['accessToken']; $conversation_stats = getConversationAnalytics($token, $_POST['conversation_id']); $talktime = []; $members = []; foreach($conversation_stats['members'] as $member_talks){ array_push($talktime, $member_talks['talkTime']['seconds']); array_push($members, $member_talks['name']); } ?>Code Explanation:
Once the “Generate Graph” button is clicked on the index.php page, the submit.php code runs to check whether or not the inputs are empty. Upon validation, generateToken() is called. The function generates a token with which to make a call with Symbl.ai’s Conversation API Speaker Analytics API. If the credentials are correct, then getConversationAnalytics() function is called where conversation data for that API endpoint is returned in the response body. Within that response body is the talk time our application serves to the Graph.js for display.
Step 4: Generating graph
On the same submit.php page, paste the below HTML code. You end with the following PHP code:
<!doctype html> <html lang="en"> <head> <meta charset="utf-8"> <meta name="viewport" content="width=device-width, initial-scale=1"> <meta name="description" content=""> <meta name="author" content="Mark Otto, Jacob Thornton, and Bootstrap contributors"> <meta name="generator" content="Hugo 0.83.1"> <title>Dashboard Template · Bootstrap v5.0</title> <link rel="canonical" href="https://getbootstrap.com/docs/5.0/examples/dashboard/"> <!-- Bootstrap core CSS --> <link href="bootstrap.css" rel="stylesheet"> <meta name="theme-color" content="#7952b3"> <style> .bd-placeholder-img { font-size: 1.125rem; text-anchor: middle; -webkit-user-select: none; -moz-user-select: none; user-select: none; } @media (min-width: 768px) { .bd-placeholder-img-lg { font-size: 3.5rem; } } body { background-color: #f9f9fa } .flex { -webkit-box-flex: 1; -ms-flex: 1 1 auto; flex: 1 1 auto } @media (max-width:991.98px) { .padding { padding: 1.5rem } } @media (max-width:767.98px) { .padding { padding: 1rem } } .padding { padding: 5rem } .card { background: #fff; border-width: 0; border-radius: .25rem; box-shadow: 0 1px 3px rgba(0, 0, 0, .05); margin-bottom: 1.5rem } .card { position: relative; display: flex; flex-direction: column; min-width: 0; word-wrap: break-word; background-color: #fff; background-clip: border-box; border: 1px solid rgba(19, 24, 44, .125); border-radius: .25rem } .card-header { padding: .75rem 1.25rem; margin-bottom: 0; background-color: rgba(19, 24, 44, .03); border-bottom: 1px solid rgba(19, 24, 44, .125) } .card-header:first-child { border-radius: calc(.25rem - 1px) calc(.25rem - 1px) 0 0 } card-footer, .card-header { background-color: transparent; border-color: rgba(160, 175, 185, .15); background-clip: padding-box } </style> <!-- Custom styles for this template --> <link href="dashboard.css" rel="stylesheet"> </head> <body> <header class="navbar navbar-dark sticky-top bg-dark flex-md-nowrap p-0 shadow"> <a class="navbar-brand col-md-3 col-lg-2 me-0 px-3" href="#">Symbl.ai</a> <button class="navbar-toggler position-absolute d-md-none collapsed" type="button" data-bs-toggle="collapse" data-bs-target="#sidebarMenu" aria-controls="sidebarMenu" aria-expanded="false" aria-label="Toggle navigation"> <span class="navbar-toggler-icon"></span> </button> </header> <div class="container"> <div class="row"> <!-- <nav id="sidebarMenu" class="col-md-3 col-lg-2 d-md-block bg-light sidebar collapse"> --> <nav id="sidebarMenu" class="col-md-3"> <div class="position-sticky pt-3"> <ul class="nav flex-column"> <li class="nav-item"> <a class="nav-link active" aria-current="page" href="index.php"> <span data-feather="home"></span> Home </a> </li> </ul> </div> </nav> <main class="col-md-9 ms-sm-auto col-lg-10 px-md-4"> <div class="d-flex justify-content-between flex-wrap flex-md-nowrap align-items-center pt-3 pb-2 mb-3 border-bottom"> <h1 class="h2">Dashboard</h1> </div> <div class="page-content page-container" id="page-content"> <div class="padding"> <div class="row"> <div class="container-fluid d-flex justify-content-center"> <div class="col-md-10"> <div class="card"> <div class="card-header">Symbl.ai Conversations API</div> <div class="card-body" style="height: 600px"> <div class="chartjs-size-monitor" style="position: absolute; left: 0px; top: 0px; right: 0px; bottom: 0px; overflow: hidden; pointer-events: none; visibility: hidden; z-index: -1;"> <div class="chartjs-size-monitor-expand" style="position:absolute;left:0;top:0;right:0;bottom:0;overflow:hidden;pointer-events:none;visibility:hidden;z-index:-1;"> <div style="position:absolute;width:1000000px;height:1000000px;left:0;top:0"></div> </div> <div class="chartjs-size-monitor-shrink" style="position:absolute;left:0;top:0;right:0;bottom:0;overflow:hidden;pointer-events:none;visibility:hidden;z-index:-1;"> <div style="position:absolute;width:200%;height:200%;left:0; top:0"></div> </div> </div> <canvas id="chart-line" width="500" height="500" class="chartjs-render-monitor" style="display: block; width: 500px; height: 500px;"></canvas> </div> </div> </div> </div> </div> </div> </div> </main> </div> </div> <!-- <script src="bootstrap.js" ></script> --> <!-- <script src="https://cdn.jsdelivr.net/npm/[email protected]/dist/feather.min.js" integrity="sha384-uO3SXW5IuS1ZpFPKugNNWqTZRRglnUJK6UAZ/gxOX80nxEkN9NcGZTftn6RzhGWE" crossorigin="anonymous"></script> --> <script src="https://maxcdn.bootstrapcdn.com/bootstrap/4.0.0/css/bootstrap.min.css" ></script> <script src="https://stackpath.bootstrapcdn.com/bootstrap/4.0.0/js/bootstrap.bundle.min.js" ></script> <script src="https://cdnjs.cloudflare.com/ajax/libs/jquery/3.2.1/jquery.min.js" ></script> <script src="https://cdn.jsdelivr.net/npm/[email protected]/dist/feather.min.js" integrity="sha384-uO3SXW5IuS1ZpFPKugNNWqTZRRglnUJK6UAZ/gxOX80nxEkN9NcGZTftn6RzhGWE" crossorigin="anonymous"></script> </body> </html>Code Explanation:
The code might look a bit lengthy but is nothing more than a simple HTML page that is used to display the graph. If you look at the JavaScript script, you’re using graph.js to make the interactive graphs with Symbl.ai’s Conversation API Speaker Analytics API.
Step 5: Generating Dynamic Graph
At the bottom of the HTML file add the following code:
<script src='chart.js'></script> <script> $(document).ready(function() { var ctx = $("#chart-line"); var myLineChart = new Chart(ctx, { type: 'bar', data: { labels: ["Member"], datasets: [ <?php foreach($conversation_stats['members'] as $member_stats){ ?> { data: [ <?php echo $member_stats['talkTime']['seconds']; ?>], label: "<?php echo $member_stats['name']; ?>", borderColor: "<?php echo '#' . str_pad(dechex(mt_rand(0, 0xFFFFFF)), 6, '0', STR_PAD_LEFT); ?>", backgroundColor: "<?php echo '#' . str_pad(dechex(mt_rand(0, 0xFFFFFF)), 6, '0', STR_PAD_LEFT); ?>", fill: false }, <?php } ?> ] }, options: { title: { display: true, text: 'Talk Time Analytics (seconds)' }, scales: { yAxes: [{ scaleLabel: { display: true, labelString: 'Talktime' } }] } } }); }); </script>Code Explanation:
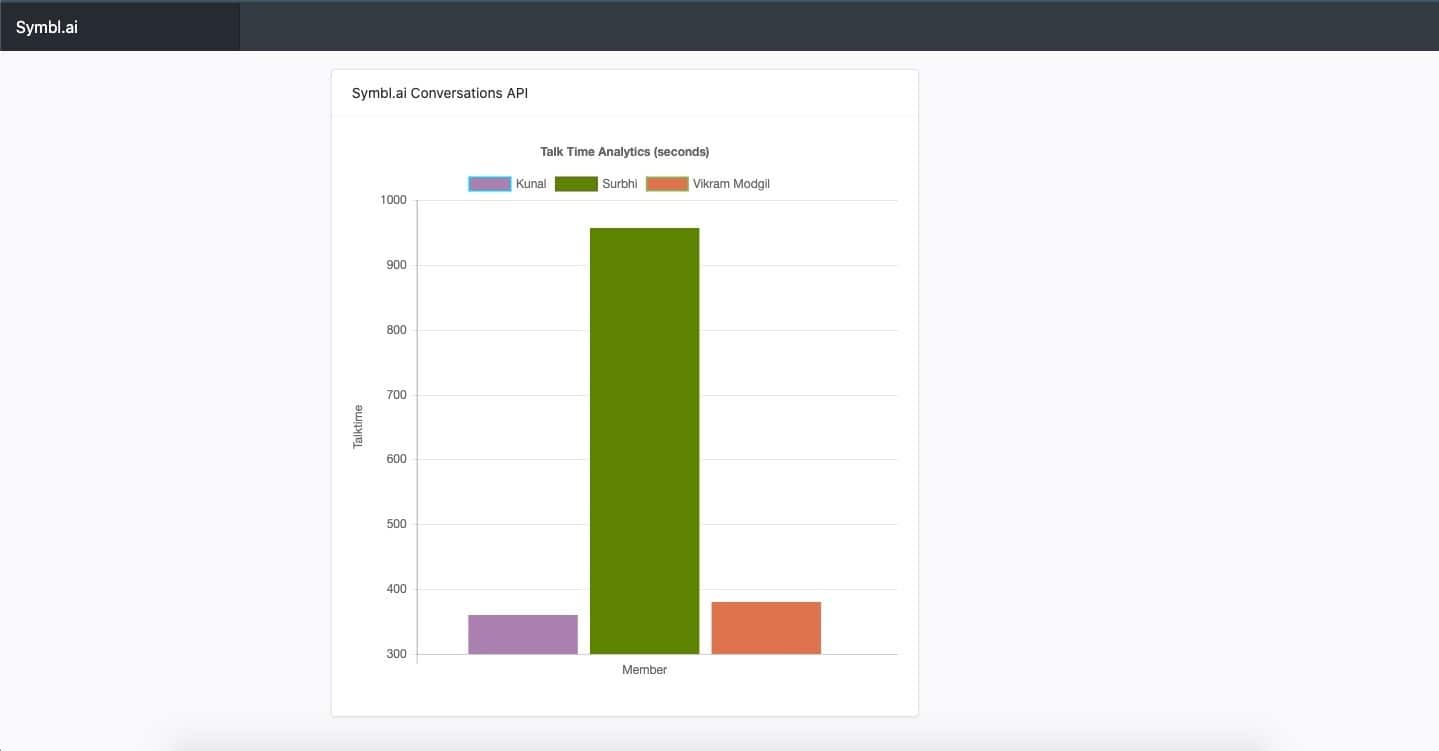
In the above code there is a JavaScript function that calls chart.js to enable the graph functionalities. Now (document).ready() we’re creating a chart object and passing the values coming from Symbl.ai’s Conversation Analytics API. After that, we’re using <?php echo ‘#’ . str_pad(dechex(mt_rand(0, 0xFFFFFF)), 6, ‘0’, STR_PAD_LEFT); ?> to generate random HEX codes for the graph so that every time someone loads the graph, it’ll return a different color. Then, in the options part, we’re passing the X-axis placeholder and Y-axis placeholder that is ‘Talk Time Analytics (seconds)’ and Member respectively.
Final Output:
Final Words
Your application produces human readable representations of timestamped conversation data. You rely upon Chart.js as well as Symbl.ai’s Conversation Intelligence API platform to program the specific type of intelligence you desire to glean from that timestamped conversation data.
What’s Next
Your application built a page to return speaker analytics for talk time on a conversationId from a conversation already analyzed by Symbl.ai’s Async APIs. In your next iteration on the same application, you can configure your application to switch between the different types of return data from Symbl.ai’s Conversation API’s Speaker Analytics API with user preferences through a drop down menu or through a refactoring of the page for displaying the results of a call to that API endpoint. In addition you could create a scheme for color patterns to match commonalities. If a speaker speaks more than others, you could label their speech as red with the next to least in light green, the next to most in dark green, to contrast the differences in the speaker’s length of time. If you were to analyze batches of conversation data, you could identify a speaker whose bar graph is red more often than not. You could just tell that speaker to “shut up!” or to take a more measured approach to the time available on a call.
<script src=”https://gist.github.com/eric-giannini/d48df47428e313a0ddf78103cdc4adc3.js"></script> <script src=”https://gist.github.com/eric-giannini/6e1e28048fbf8b46469dee2e220fe5e3.js"></script>
Community
In addition to GitHub, the team at Symbl.ai really values feedback from developers on their docs: https://docs.symbl.ai/docs/. If you have feedback or would like to speak to Symbl.ai about your integration, join their Slack channel or reach out to them directly via email: [email protected]. In addition, Symbl.ai is actively seeking developers to join its development efforts. If you would like to sign up to create content, test their APIs, or create community engagement around their APIs, sign up for our developer.symbl.ai/programs.